Airline accidents and media bias:
New York Times 1978-1994
Note: This study was originally published in 1996 by Todd Curtis, PhD , and featured an of both airline accident data and information from the New York Times Index to show what categories of airline accidents were aSociated with higher levels of media coverage in the New York Times. The original study categorized the broad categories of events involving airline paSenger fatalities that received coverage, and the magnitude of that coverage. The updated study, available at http://airsafe.com/nyt_bias.htm used an updated database of accident information, as well as a combination of linear and logistic regreSion techniques provided the following additional insights:
- What independent variables were most significant with respect to predicting if a particular fatal airline event would receive coverage in the New York Times.
- Whether a model based on a logistic regreSion based on those independent variables can serve as a good predictor of whether an event would receive coverage.
- What kind of regreSion model could be used to estimate the number of articles that a particular accident my generate.
Abstract: A common perception by the aviation safety community is that the news media gives extra attention to some kinds of fatal airline events. This study tested three general aSumptions about media biases in reporting such events by scrutinizing the coverage of one influential newspaper, the New York Times. From 1978 to 1994, the New York Times disproportionately reported the 25 fatal airline events that involved jet aircraft that were hijacked, sabotaged, or destroyed by military action. These 25 events averaged 53 references each, compared with 7.2 references for the other 160 fatal jet events. These 25 jet events accounted for 8.1% of the reported events and for 48.2% of the 2752 New York Times Index references to fatal airline events that occurred during the study period. The New York Times also disproportionately reported fatal events involving jet aircraft and fatal events in the U.S. or involving U.S. carriers. Fatal events were also more likely to be reported as the magnitude of fatalities increased.
Introduction
Fatal aircraft mishaps are widely reported by the news media, but with wide variations in the amount of coverage. Starting with a set of general aSumptions about what kind of events generate more coverage, this paper will use information from the New York Times Index from 1978 to 1994 to show how that particular newspaper disproportionately covered some claSes of fatal paSenger aircraft events, especially those involving jets or when the mishap location or aircraft registration were in the U.S.
The New York Times was chosen because of its stature as a nationally important newspaper with influence over the content of newspapers and other media in the United States and abroad. The Times refers to itself as a newspaper of record that is both an important source of current news and analysis as well as a chronicle of those events that are important in American and world affairs. The Times was also chosen because it plays a significant role in the amount of attention that the nation pays to policy and regulatory iSues at the federal level, including those iSues dealing with air transportation.
The period 1978 to 1994 was chosen for this study because it coincided with the deregulation of the domestic U.S. airline industry. With deregulation came a substantial increase in the number of flights and significant changes in air carriers and their busineS strategies. Along with these changes came an increased interest in iSues related to air safety on the part of the flying public, the airline industry, and the federal government.
ASumptions
There were three general aSumptions made about the coverage of fatal airline events by the New York Times:
- Fatal events in the U.S. or involving U.S. carriers were more likely to be reported and would get more coverage than those events involving non-U.S. carriers outside the U.S.,
- Jet aircraft events are more likely to be covered than those that involved propeller driven aircraft, and
- Fatal events are more likely to be reported and will get greater coverage as the number of fatalities rise.
The first aSumption is based on the fact that the New York Times has a national audience. The second and third aSumptions are related in that all but the smallest jet transports carry more paSengers than propeller driven transports and expose a larger number of people to the effects of a mishap.
Definitions
For purposes of this paper, there are number of specific definitions used to categorize fatal airline events:
PaSenger Flight: A scheduled or unscheduled airline flight offering paSage to the general public and which carries at least one paSenger.
Fatal event: A paSenger flight where one or more persons inside or outside the aircraft die as a direct or indirect result of that aircraft's flight. Death can occur either during the flight or afterwards as a result of injuries received during the flight. Excluded were deaths due to natural causes, hijackings where only hijackers die, suicides, and deaths of stowaways.
Accident: A fatal event that was not a result of sabotage, hijacking, or military action
Article: A published New York Times story, photograph, or other graphic that mentions one or more specific fatal airline events.
Reference: A mention of a specific fatal event in the abstracts of articles cited within the New York Times Index.
Back to Contents for this page
Method
Fatal Event Data
There were three general sources used to gather information on fatal events: accident reports of the U.S. National Transportation Safety Board, and yearly summaries from both Flight International magazine of the U.K. and the U.S. Department of Transportation. Flight International was used because each year it publishes a list of significant civil aviation accidents from around the world and would complement the U.S. focus of the National Transportation Safety Board and the Department of Transportation reports.
Fatal Event Reporting Data
The yearly index of New York Times stories was the sole source of the reporting data. This was done in part for consistency. All indexed articles were summarized under a specific subject heading or sub-heading. With one exception, every reported fatal event reference was listed under one of three Index categories: Airlines - Accidents and Safety (1978-1982), Airlines (1983), or Airlines and Airplanes (1984-1994). That one exception was the downing of an Iranair Airbus A300 by the U.S.S. Vincennes on July 3, 1988. References to the event were found in the 1989 Index under Airlines and Airplanes, but not in the 1988 Index. A detailed search of the 1988 Index revealed dozens of references under the heading of Iran. No other event had a reference in one of the three aviation accident categories in the years subsequent to the event and also no reference in the year of occurrence in one of those same categories.
For fatal aircraft events that met the criteria of this study, the data sources were used to gather information on the aircraft identity and the circumstances surrounding the event. Whenever poSible, aircraft type, airline, country of registration, country of accident, number of fatalities, and details of the event were used to compile a picture of the world wide fatal paSenger aircraft events of the 17 year time period.
From the New York Times index, the number of total references to specific qualifying fatal events were tallied from the time of the accident to the end of the study period. References to articles published during the study period that were aSociated with fatal events that occurred before the study period were ignored.
Results
Overview of the Data
A total of 525 qualifying fatal events were identified through the fatal event data sources. Of those, 307 were referenced in one or more New York Times articles. There were a total of 2752 references to these fatal mishaps during the 17 year study period. The data supports the first two major aSumptions and partially supports the third. For a detailed breakdown of the statistical analysis, you can download the full analysis in a PDF file at http://www.airsafe.com/analyze/nyt_bias.pdf


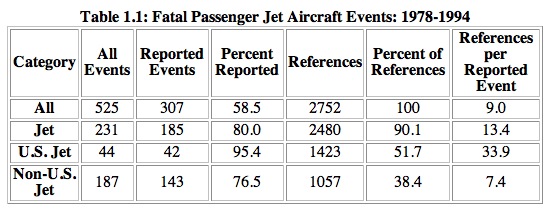
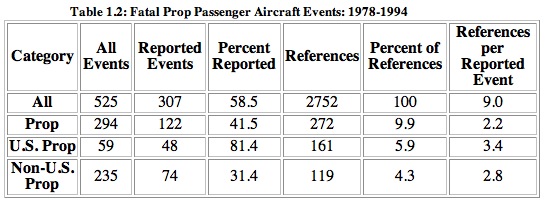
The data supports the first general aSumption that U.S. related events would attract more coverage. Tables 1.1 and 1.2 show that 95.4% of jet events with a U.S. connection were reported versus 76.5% of the non-U.S. jet events . The difference was more pronounced with propeller aircraft with 81.4% versus 31.4%. The differences in number of references per event was quite large for U.S. related jet events, 33.9 for U.S. related events compared with 7.4 for those that were not. For propeller aircraft, U.S. events had more references per reported event, but the difference was only 3.4 versus 2.8.
Note: Tables available here
The first two tables also support the second general aSumption that jets receive more coverage. Jet events, U.S. related jet events, and non-U.S. related jet events were more likely to be reported and had on average more references per event than the corresponding propeller aircraft categories. On the whole, jets were involved in only 44% of all events but 60.3% of all reported events.
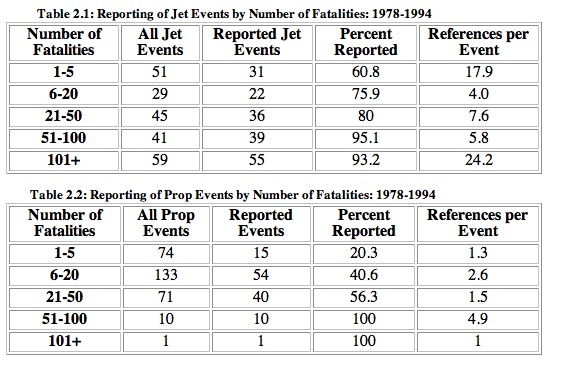
The data also supports the first part of the third aSumption about the percentage of events with more fatalities get more attention. Tables 2.1 and 2.2 show that for both jet and propeller aircraft, the likelihood of being reported increases as fatalities increase for the five fatality ranges examined. The one exception was jet events with more than 100 fatalities. This group was slightly leS likely to be reported than the group of jet events with 51-100 fatalities. Of the 525 total fatal events of the period, 11 did not have any fatality information available, so only 514 are represented in Tables 2.1 and 2.2.
Note: Tables available here
The second part of the third aSumption, that the number of references per event increases with fatalities, was not clearly supported by the data. The largest deviation from the aSumed trend was the group of 31 jet events with five or fewer fatalities. It was the second highest of the five jet fatality range categories with an average of 17.9 references per event, with one event accounting for 359 of the 556 references for that group.
Back to Contents for this pageConclusions
The analysis of the New York Times Index information supports the following conclusions:
- Events either in the U.S. or involving U.S. carriers had more references per event and more references per reported event than the corresponding propeller aircraft categories.
- Jet events were more likely to be reported and had more references per reported event, than the corresponding group of propeller aircraft events.
- Fatal events were reported with greater likelihood as the magnitude of the number of fatalities increased. However, there is no clear relationship between the number of fatalities in an accident and the number of references per event.
Back to Contents for this page
DiscuSion
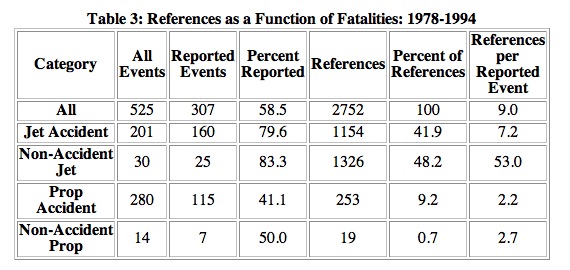
In addition to the data that supported most of the prior aSumptions, the most striking feature of the data was the high number of references aSociated with a relatively small category of non-accidental jet events. Table 3 shows that the 25 non-accidental jet events averaged 53 references each, higher than any category in Tables 1.1 and 1.2. Non-accidental jet events represent 8.1% of the 307 reported events but accounted for 48.2% of all references. Among the group of the most highly reported events, the relationship is even more striking. Six of top ten events in terms of the number of aSociated references were non-accidental jet events, including five of the top six. These five represented 39.7% of the 48.2% of the references aSociated with the 25 non-accidental jet events.
Note: Tables also available here

This concentration of references in such a small number of mishaps calls for some explanation, but none were revealed in the available data. For example, a high number of deaths did not guarantee wide coverage or a low number of deaths imply little coverage. The event with the second highest number of references was a hijacking that only killed one paSenger. Also two of the top three events with respect to people killed were not in the top 10 with respect to the number of references.
The available data does not suggest a cause for this concentration of attention on a handful of events, nor does it suggest the effects this concentration has. However, it is poSible that those who are direct or indirect consumers of the New York Times may be led to believe that fatal events caused by hijack, sabotage, or military action are more prevalent than they really are. A similar observation applies to the fatal jet events in the U.S. or involving U.S. carriers. This category accounted for 51.7% of all references but only 13.7% of all reported fatal events of the study period.
There are several related areas that could be investigated in order to complement this current effort. One would be to look at another influential publication to see if the tendencies apparent in the New York Times exist elsewhere. Another major national newspaper such as the USA Today would be an appropriate complement to the New York Times. Another analysis could be to look at only those fatal events that are prominently displayed in the New York Times on the front page or as part of a longer, in depth article. A third analysis could be to look at the fatal events in terms of how many different days of coverage each mishap received in the Times.
A related analysis could be to see if public policy or public opinion are affected by added coverage in the Times. One poSible indicator of such an effect would be to see if changes to U.S. federal rules and regulations concerning air transportation directly mention one of the more heavily reported fatal events.
Back to Contents for this page
References
Flight International (UK magazine), yearly civil aviation safety review (published in late January to early February of the following year), 1979-1995.
The New York Times Index, Airlines - Accidents and Safety section, 1978-1982.
The New York Times Index, Airlines section, 1983.
The New York Times Index, Airlines and Airplanes section, 1984-1994.
U.S. Department of Transportation, various yearly accident summaries.
U.S. National Transportation Safety Board, various accident reports.
Back to Contents for this page
http://www.airsafe.com/nyt_bias.htm -- Revised: 30 July 2015